

Why forecast at all?
Someone always needs to know. A customer has promised their board a launch. Marketing has booked a campaign. A regulator has set a date. Finance wants to know what this quarter buys. None of these people are being unreasonable. They have decisions to make, and your delivery is one of the inputs.
So the question "when will it be done?" is not going away, and neither is "how much can you do by then?". The only choice you have is how you answer. Most teams answer with a number and a hope. This post is about answering with a range and a probability, built from data your team already produces every day.
Forecasting done well does something estimation never did. It turns a negotiation about dates into a conversation about scope and risk. "We have an 85% chance of finishing this by the 14th. If that is too late, here is what we can leave out" is a sentence stakeholders can act on. "It'll be done in three weeks" is a sentence everyone knows is a guess, including the person saying it.
Why it is hard
If forecasting were easy, nobody would write blog posts about it. Three things make it hard.
Complexity. Knowledge work is not a production line. The same-sized item can take a day or a fortnight depending on what you discover when you open it. Dependencies appear. The person who understands that part of the system is on holiday. The problem turns out to be different from the one in the ticket. You cannot know these things in advance, which is exactly why estimating them in advance keeps failing.
Variability. Even with no surprises, teams do not deliver at a steady rate. Some days three items finish, some days none, some days twelve because a batch cleared at once. People are off. Meetings land. A release blocks the pipeline. Any honest forecast has to carry that variability inside it rather than averaging it away.
Stakeholder expectations. The moment you say a date, it becomes a promise in someone else's calendar. Say a range and they hear the earliest number. Say a probability and they ask for the date anyway. Part of forecasting is teaching the people you forecast for how to read it, and that only works if the forecast is honest enough to survive contact with reality. A method that produces confident wrong answers teaches them not to trust you.
The methods we grew up with
Absolute time. Ask the people doing the work how many hours or days each item will take, add it up, divide by the team. This is the oldest method and the worst. It asks humans to predict the one thing they are demonstrably bad at predicting, it ignores the queueing and waiting that make up most of an item's life, and it hands stakeholders a false precision that collapses the first time something is discovered.
Relative sizing. Story points, t-shirt sizes, Fibonacci. A genuine improvement, because it stopped pretending we could know hours and asked a better question: how big is this compared to that? Combined with velocity it gave a rough rate. But relative sizing still spends real time on estimation sessions, still invites debate about the number rather than the work, and velocity still gets turned into a target the moment a manager sees it. Worse, it answers "how big?" when the useful question is "how long will it take to come out the other end?", and size is only one small part of that.
Both methods share a root problem. They try to predict the future by reasoning about individual items. Flow-based forecasting does something different: it measures how work actually comes out of your system and lets that measurement speak.
The data you already have
Every team that tracks work on a board, physical or digital, is already producing the data a forecast needs. You just have to record two dates per item.
- Started: the day an item crossed the line where the team committed to it.
- Finished: the day it reached your definition of done.
From those two dates come the four flow metrics:
- Throughput: how many items finished per day (or week). The count. No sizes.
- Cycle time: the days between started and finished for each item.
- Work in progress (WIP): how many items are between those two lines right now.
- Work item age: how long each item currently in progress has been there.
They are tied together by Little's Law: on average, cycle time equals WIP divided by throughput. Which is why a board that looks like this has throughput that tells you almost nothing.
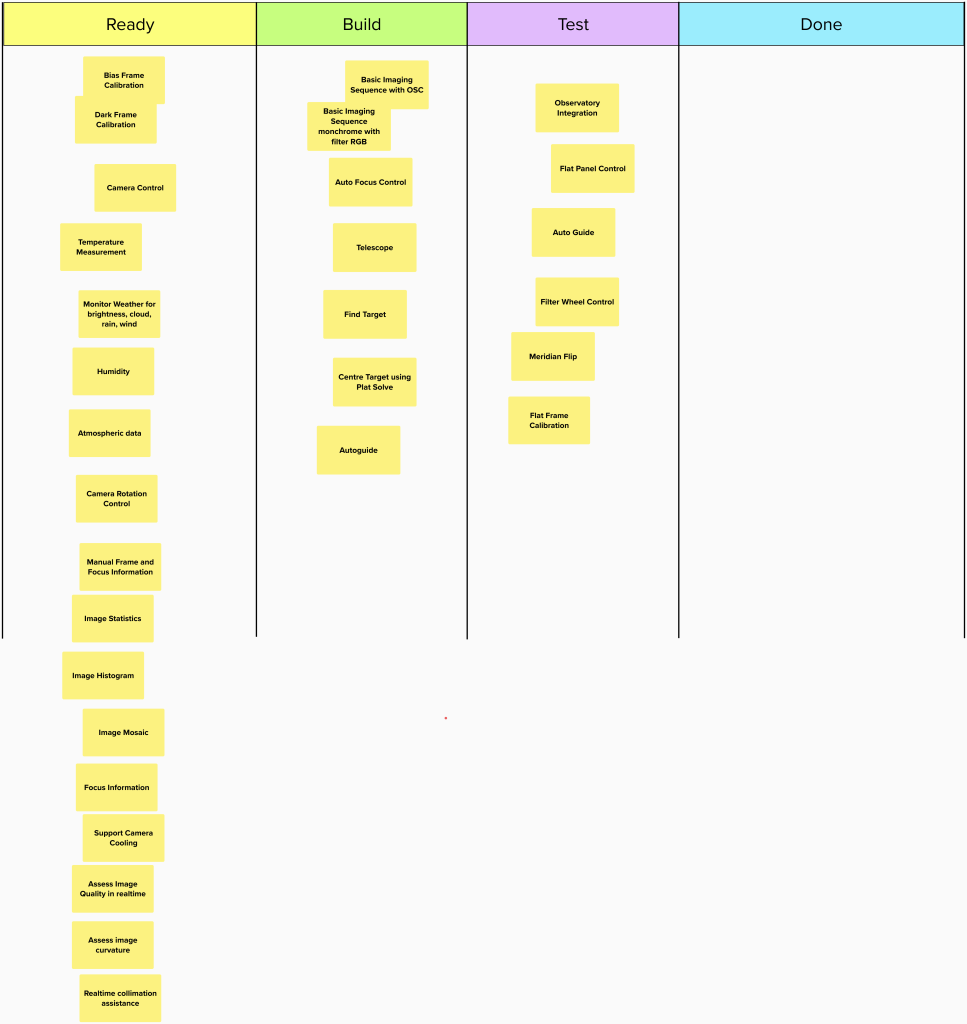
Build and test are full. Done is empty. Nothing is stopping new work starting, so nothing is finishing. Limit the work in progress and the picture changes: items have to leave before new ones enter, and finishing becomes the team's job rather than starting.
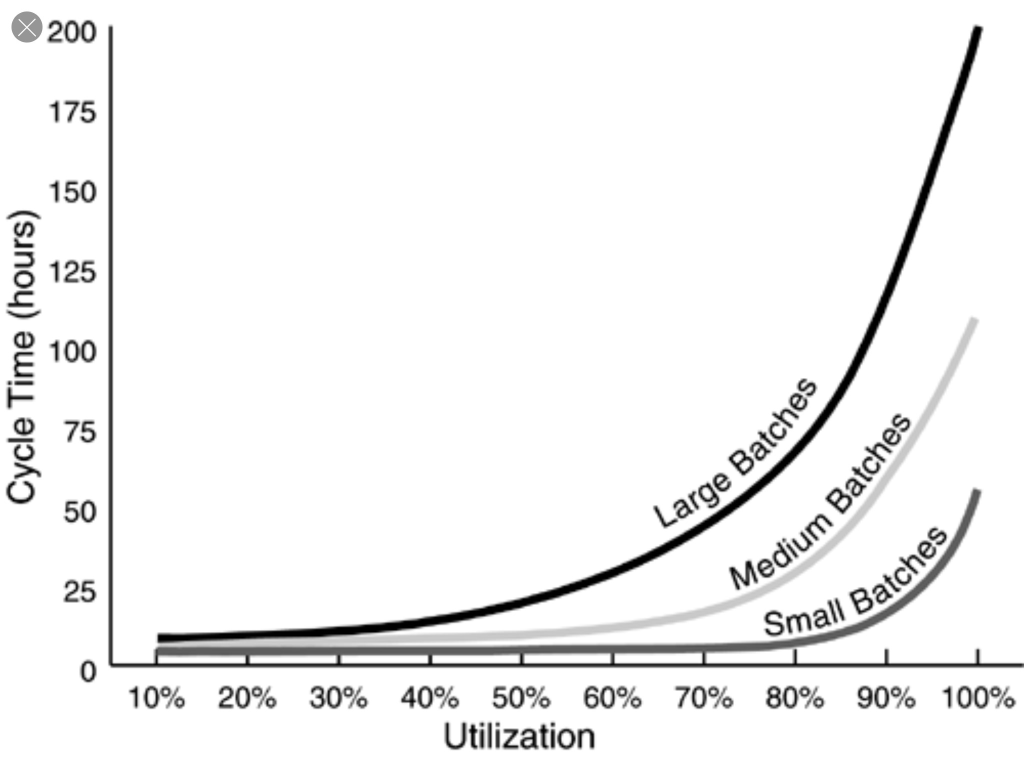
Scrum teams already have this shape. One Product Goal, one Sprint Goal, a usable Increment every Sprint. Kanban systems make the limits explicit. Either way, a system with controlled WIP produces throughput you can forecast from, because its throughput reflects the team's capacity rather than the size of the pile.
For forecasting we need only one of the four metrics: throughput. Record the date each item reaches done. Count per day. That is the whole data model.
| Done | Items finished |
|---|---|
| 22/06/2023 | 1 |
| 23/06/2023 | 0 |
| 24/06/2023 | 1 |
| 25/06/2023 | 2 |
"But don't all items need to be the same size?"
This is the first objection every time, and the answer is no.
A throughput forecast samples from the days your team has actually had. If Tuesday finished three items and Wednesday finished seven, the difference in size, the blocker, the interruption, the person who was off, all of it is already inside those two numbers. You are not pretending items are equal. You are letting the variation show up where it belongs: in the range of the forecast.
What matters is not that items are the same size, but that they are right-sized: consistently small enough to flow through your system without clogging it.
- Same-sizing is estimation theatre. Forcing every item to the same effort ignores the real differences in knowledge work and spends time on precision that never pays back.
- Right-sizing is a yes/no check when you pull the work. Can we finish this within our service level expectation, the time 85% of our items take? If not, split it. Days, not weeks. A thin slice of value end to end, not a layer. Something a stakeholder can react to quickly.
The mindset shift is from "how big is this?" to "is this small enough?". The first question invites argument. The second takes ten seconds and is answered by the people about to do the work.
Right-sizing is also what makes the forecast tighten. The simulation below has a slider for it, and you will see why.
Replay the days you have already had
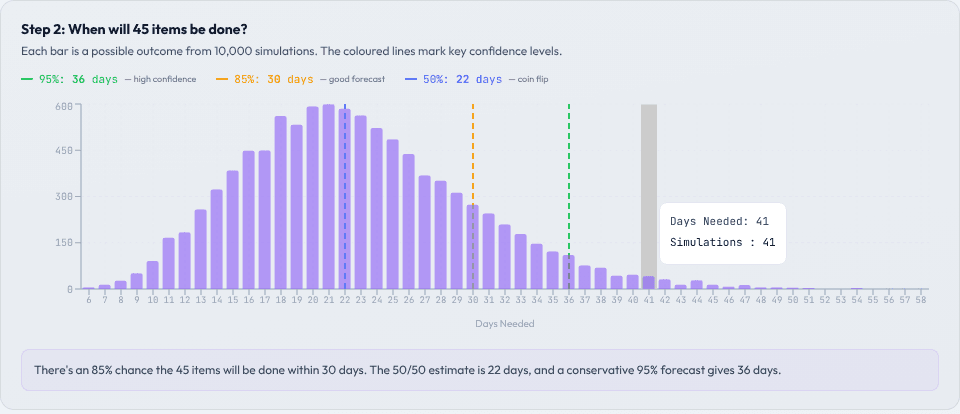
Here is the whole method. To answer "when will these 100 items be done?", pick a random day from the team's history, subtract what they finished that day from 100, and repeat until nothing is left. Count the days it took. Now do that ten thousand times. You have ten thousand possible futures, each built only from days this team has really had, and you can see how many of them finished within 40 days, or 50, or 60.
"How many can we do in 45 working days?" is the same idea the other way round: pick 45 random days and add up what got finished, ten thousand times.
That is a Monte Carlo simulation. No estimates. No sizes. No meeting. Traditional estimation asks each person how long their piece will take and adds up the guesses. This looks at how work has actually flowed and lets the data answer.
The tool below is loaded with the daily throughput of a real team from the Mastering Kanban lab: 75 working days, 305 items, including the quiet days. Then switch to your own numbers.
Try it
Forecast from throughput, right here
The simulation below samples a team's daily throughput 10,000 times and replays it to build a range of outcomes. Nothing is estimated. Change the question, the scope, or paste your own numbers.
Running the simulation…
This is one step of the Mastering Kanban lab. There you build the board, generate the data and forecast on it.
Try the labReading the forecast
Three numbers matter, and they mean different things.
- 50% is a coin flip. Half the simulated futures finished sooner, half later. Fine for internal planning. Dangerous as a promise, because it will be late half the time and that is the half people remember.
- 85% is the number to forecast with. Eighty-five of a hundred futures were done by this point. Confident without being wildly pessimistic. When a stakeholder needs one date, this is it.
- 95% is for when being wrong is expensive: a contractual deadline, a launch with a campaign behind it, a regulator.
The gap between them is information. A tight hump means predictable flow and a forecast you can say out loud. A long tail to the right means days of nothing followed by bursts, which is what the sample team has. No amount of better estimating fixes that. You fix it by changing the system that produces the days: lower WIP, smaller items, fewer handoffs.
Now go back to the tool and move the right-sizing slider. It keeps the team's average exactly where it was and only reduces the day-to-day swing. Watch the 85% and 95% answers walk towards the 50%. Same amount of work, same team, and a date you can actually commit to. That is the whole business case for right-sizing, in one slider.
Two habits make this stick. Commit to a goal, never to scope, because conditions change and the forecast will move. And re-run it every week with the new days added. The movement is not noise. It is your system telling you something changed.
Do it on your own board
You already have the data. Export the done dates from your tool, count per working day, and paste the counts into the tool above. In a minute you have a forecast you can take into Monday's planning that no estimation session could have produced.
If you want to go further, the Mastering Kanban lab is where this came from. You build the board, run the simulations that generate the data, learn to read cycle time and ageing work, and forecast on numbers you created yourself. It is the difference between reading about flow and feeling it.
Go deeper
Mastering Kanban
Put this into practice with the course that covers it in depth.
View the course